PHP Code Coverage Tools
 Code Coverage tools help discover which parts of an application get executed during a test. The most common use case is to measure how much of the code base gets executed, and thus "covered" and "tested" during a test. While 100% of code coverage during a test does not mean the application will be bug-free, it is a measurable indication on how thorough the unit tests are.
Code Coverage reports can reveal how effective those tests are, and tools such as PHPUnit can generate meaningful reports using the code coverage data.
 PHPUnit has support various formats to report code coverage, including a simple CLI output option.

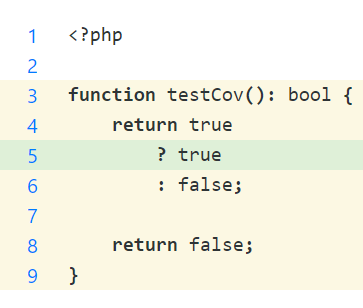
Code Coverage tools are not perfect. Some tools can report specific lines that were executed, and some tools can go as far as showing which specific branches of code were executed.
| Line Coverage | Dead-Code Indication | Path Coverage |
|---|---|---|
 |
 |
 |
Generating Code Coverage Reports
PHPUnit, the popular PHP Unit Testing framework supports Xdebug, PCOV, and phpdbg for code coverage reports. sebastianbergmann/php-code-coverage is the package used by PHPUnit for its code coverage functionality. It's possible to use this library as an abstraction layer for various code coverage tools.
In PHPUnit 9.x series, Code Coverage can be enabled from the phpunit.xml(.dist) configuration file, with a setup similar to this:
<coverage>
    <include>
      <directory suffix=".php">src/</directory>
    </include>
    <report>
      <html outputDirectory="build/coverage"/>
      <text outputFile="build/coverage.txt"/>
    </report>
</coverage>
Using code coverage data from the tool used (such as PCOV or Xdebug), PHPUnit can generate code coverage reports in various formats that are human-readable and machine-readable for further processing.
If path coverage is desired, that can be specified from the XML configuration file as well:
- <coverage>
+ <coverage pathCoverage="true" cacheDirectory="build/phpunit/cache">
PHP Code Coverage Tools
PHP Code Coverage feature is often provided as part of a bigger tooling the PHP developers would use otherwise.
-
Xdebug, a PHP extension project started back in 2002 by Derick Rethans is the de-facto tool that helps in step debugging, profiling, and of code in code coverage.
-
PCOV, a recent PHP extension by Joe Watkins aims to be a minimal and fast solution for code coverage, which solves the often slow Xdebug version 2 series.
-
phpdbg is a PHP Debugger shipped with PHP itself. It has features similar to Xdebug, albeit relatively less adoption in community and IDEs.
phpdbgis implemented as a server API, which limits its usefulness, but it provides an easy approach to code coverage without having to install PECL extensions.
Xdebug
Xdebug is a mature and actively developed PHP extension with a profiler, step debugger, and a code coverage tool. Due to the complex architecture and rich feature set, Xdebug is often slow, and using Xdebug often results in the tests to run considerably slow.
Code Coverage data from Xdebug provides information about dead code (code that will never be executed), and it also supports code path coverage, although it is significantly slower in practice. Xdebug is the most accurate and precise code coverage tool, as it even has custom handling when the Zend/Opcode does not provide enough information to infer accurate code coverage.
Xdebug version 3 is active development, and had its first beta release recently. For the benchmark and comparison purposes, Xdebug 2.9.8 and the latest code from master branch are used for the upcoming version 3.
Xdebug 3 splits the functionality to "modes". Unlike Xdebug 2 that had toggles for individual features (code coverage, step debugger, and profiler), Xdebug 3 simplifies the configuration and code with only one mode active at a time. Xdebug 3 in coverage mode is provides the same code coverage functionality, but it is significantly faster in Xdebug 3.
 Xdebug provides dead-code information. In code coverage reports, they can help discover snippets that have no code paths leading to them.
Xdebug also supports path coverage, which means it can detect execution of individual branches in a statement.

Xdebug version 3
Xdebug 3 is the upcoming version of Xdebug. Xdebug 3 is not released as a stable version yet, but beta versions are available, and compiles just fine on PHP 8 that already has its API/ABI frozen.
Xdebug 3 introduces "modes". In contrast to various toggles for Xdebug features, it now only functions in different modes, be it step debugger, profiler, or a code coverage. This gives a significant performance improvement over the previous version.
PCOV
PCOV is a PECL extension designed for code coverage and code coverage alone. It does not support path coverage, nor dead-code analysis, but it is the fasted (benchmarks below) extension approach to PHP code coverage.
It is not possible to run Xdebug and PCOV at the same time, but PCOV provides an INI toggle to keep the extension loaded, but the functionality disabled.
PCOV has the advantage of being fast and light-weight because it is not a debugger. It is light-weight code base, without the sophisticated extra complexity Xdebug carries as Xdebug has custom functionality to provide more accurate results. PCOV code coverage data are comparable to Xdebug's and except for a few edge cases, the code coverage results would be the same.
phpdbg
phpdbg is a PHP Debugger shipped with PHP itself, since PHP 5.6. It is a feature-full debugger that is implemented as a Server API.
First developed by Joe Watkins, the author of PCOV, and then phpdbg was later merged to PHP core itself. It has code coverage support among its other features.
phpdbg does not offer path coverage. phpdbg being a separate SAPI, it is easy to invoke phpdbg without toggling any extensions.

phpdbg is called with phpdbg in terminal, and it will run standard PHP CLI with phpdbg features (including code coverage) enabled.
PHP Code Coverage Benchmark
Using a code coverage tool can slow down the execution time of unit tests. This benchmark compares the relative execution time with each code coverage tool.
CommonMark from The PHP League supports PHPUnit 9.4, and contains more than 3,000 tests. Comparing the execution time of the test suite with each code coverage tool reveals the impact of each tool.
The values are averages of five runs on PHP 7.4.11.
Despite the minor differences in how PCOV reports coverage information, PCOV is extremely fast. Xdebug 3 is significant improved compared to Xdebug 2. Note that Xdebug 3 is still in beta.
The same test was done on PHP 8 development branch, with PCOV and Xdebug 3 compiled against it.
Path Coverage
Not all PHP Code Coverage tools support path coverage. Xdebug 2 and 3 support path coverage. PCOV and phpdbg, combined with PHPUnit do not support code coverage.
Running path coverage can significantly slow down the execution.
Summary of PHP Code Coverage Tools
Xdebug 2
- Debugger with many features; Slow.
- Supports path coverage.
- Mature and actively developed.
Xdebug 3
- Fully-featured debugger, but with modes, code coverage is significantly faster than Xdebug 2.
- Supports path coverage
- Actively developed.
- No stable releases yet.
PCOV
- Dedicated code coverage tool, and is extremely fast.
- Actively maintained.
- Less granular code coverage in certain cases.
- Does not support path coverage when used with PHPUnit.
phpdbg
- Debugger with many features; Slow.
- Implemented as a separate SAPI, rather than a PHP extension.
- Less granular code coverage data.
- Does not support path coverage.


